Utilization of Neural Network to Predict Efficiency at the Shahid Rajayi Industerial Town Treatment Plant
Habib Pakrou1 * , Saeed Pakrou1 , Naser Mehrdadi2 and Mohammad Javad Amiri2
1
Civil Engineering – Environmental,
Aras International Campus,
Iran
2
Civil Engineering – Environmental,
University of Tehran,
Iran
http://dx.doi.org/10.12944/CWE.10.Special-Issue1.108
Predicting the efficiency of Shahid Rajayi industrial town treatment plant is performed in this study. The data are collected from the laboratory of the treatment plant. The correlation coefficient is performed for the candidate inputs and the treatment plant outputs in order to analyze the input and output of treatment plant and choosing the proper inputs. The input-output modeling is developed for each output COD, BOD and TSS using forward neural network. Five inputs of BOD, COD, TSS, pH and Temperature are used in this modeling. Levenberg–Marquardt algorithm is used to train the neural network. The comparison of neural networks with five inputs indicates a good correlation and it shows that we should use the minimum possible number of inputs in the structure of neural networks in the cases where the number of existing data is low for training the neural network.
Copy the following to cite this article:
Pakrou H, Pakrou S, Mehrdadi N, Amiri M. J Utilization of Neural Network to Predict Efficiency at the Shahid Rajayi Industerial Town Treatment Plant. Special Issue of Curr World Environ 2015;10(Special Issue May 2015). DOI:http://dx.doi.org/10.12944/CWE.10.Special-Issue1.108
Copy the following to cite this URL:
Pakrou H, Pakrou S, Mehrdadi N, Amiri M. J Utilization of Neural Network to Predict Efficiency at the Shahid Rajayi Industerial Town Treatment Plant. Special Issue of Curr World Environ 2015;10(Special Issue May 2015). Available from: http://cwejournal.org?p=700/
Download article (pdf)
Citation Manager
Publish History
Introduction
Today, industry and technology have a special and important position in each country. The economy of a country is mostly related to its industrial and technological productions. Although, development in the industrial fields has brought special privileges with it, but it is accompanied with serious problems for communities as well (Fahimi, 2000). One of these problems is the sullage resulted from the activity of industrial units (Chalkesh Amiri, 2010). Since the improper disposal of industrial sullages has unpleasant effects on the environment, the more complete treatment of industrial sullages becomes more important (Khosravi et al., 2013). Industrial sullages would deplete surface and underground waters in the case of disposal in the environment due to the presence of organic materials and minerals (Metcalf, 2003); in this regard, the optimization and improvement of the current situation of treatment plants got an important position in the field of environment. This is where every improvement needs to be evaluated in the current situation and new situations (Khosravi et al., 2013). However, the prediction of efficiency and performance of the system is not possible by the normal methods because of the complexities in the industrial units. Thus, using artificial intelligence methods such as fuzzy logic and artificial neural networks could simplify this evaluation (Dogan, 2008) and even make the prediction of the system’s performance possible (Guclu & Dursun, 2010). Therefore, the present study is trying to predict the efficiency of industrial Sullage treatment plant of Shahid Rajayi town using the neural network method.
Methods and Materials
One of the major issues existing in the modeling with real data is the existence of correct data with low error or noise. The standard sampling method of industrial sullages is presented here at first. Using of a robust method for modeling is essential in the case of having data with error or noise. We will then investigate the utilized neural network and training method in these networks for modeling the industrial treatment plant of Rajayi.
The Standard Method of Smpling From Industrial Sullages
The objective of providing this standard is to determine a method for sampling the industrial sullages, in which certain principles have been developed to uniform the different sampling methods and that this method is applicable in the general scale and probably would be applicable in special conditions. The main objective of sampling is to get a small bit of industrial sullage, which represents the real properties of the sullage and the most basic factors of achieving to that aim are: the point of sampling, time and frequency of sampling, maintaining the composition of the specimen until the time of the test.
Model Inputs
The input indicators of sewage, which are the inputs of neural network, are the effective parameters in analyzing the performance of a treatment plant in order to assess and enhance their performance. The specifications of sewage like anything the sewage contains and also the temperature and parameters such as BOD and COD are among these effective factors.
Neural Networks
Modeling is one of the appropriate tools for making decision and predicting the environmental events, which are being expressed often as conceptual models with mathematical relations. Environmental processes and phenomena are mostly dependent on many variables and there are complex relations between their components which causes error in the accuracy and validity of predictions (Taherion, 2006).
The artificial neural network could be utilized in better prediction of treatment system’s performance. This prediction usually relies on the existence of time data. Certain key parameters are in the industrial treatment plant, which could be used in achieving the performance of the treatment plant. These parameters include: BOD, Suspended Solids, and COD. Most literatures have used these parameters in the field of artificial neural network application for modeling industrial treatment plants.
Dissemination of information in an artificial neural network starts from the input layer. The network modifies its own weight on the training data, which are being used based on the adjusted training principles; in order to determine weights to produce the input-output map and has the lowest possible error. This process is named training. The performance of the training model should be evaluated by a series of independent test, after completing the training stage successfully. The structure of a neural network is determined by the number of layers, number of neurons in each layer, stimulus function (the output controller of each neuron), training method, weight correction algorithm, and the kind of model (Hamoda et al. 1999).
Levenberg-Marquardt Trainingalgorithm
The Levenberg-Marquardt training algorithm has a very high convergence speed, because it doesn’t need to solve the Hessian matrix and approximates it by the Jacobian matrix instead. This algorithm is used because of its learning capability and high efficiency (Russell and Norvig, 2003).
The accuracy of prediction is usually evaluated by providing data which the network is not faced with before, which is known as the network’s ability at Root Mean Square Error (RMSE), Generalization (R). For this purpose, the criteria of correlation coefficient are used to evaluate the designed network Mean Absolute Percentage Error (MAPE) and Mean Absolute Error (MAE).
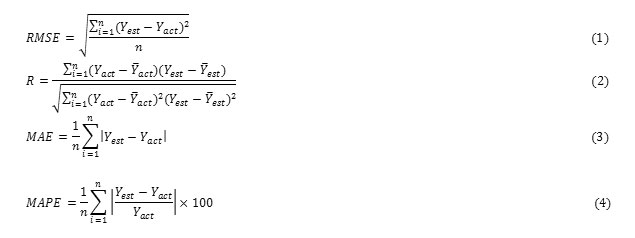
In which, n is the number of predictions; Yact is the real observed value; real observed value; Yest is the predicted value; Ȳact is the average of real observed value; and Ȳest is the average of predicted value extracted from the model (Mehdipour and Shokouhiyan, 2012).
Artificial Neural Network, Definitions and Principles
Preprocessing is needed for the weights of neural networks. Choosing the weight effect causes the network to achieve a general regional state at error reduction and the way it converges. An Epoch or time period is a cycle based on the training vectors or predefined points.
Data representation (data normalizing) is a very important issue in the neural network. Hecht-Nielsen suggest to use two different sets of data during the training. One of these sets are being used in adjusting the weight and the other one for calculating the error in some time steps. The training is continuous if the error on the second training set continues to decline. The network starts to memorize the training patterns when the error in the training set starts to increase (named validation in the neural network toolbox of MATLAB). Consequently, the training section will stop (Konar, 1999).
Stopping criteria can be defined as a criteria to stop the training. The training stops when the validating error increase for a certain number of iterations, and the weight and attitude return to the minimum validation error (Matlab Help, 2002).
Coding and Matlab Neural Network Toolbox
Developing the model is done by MATLAB software, version 2013, from the Mathworks Co. A code is written in the solver in order to search automatically, which creates an artificial neural network for the trained function at a predefined area of the number of neurons at the hidden layer, etc. A pre-developed neural network is used here with written codes to produce an artificial neural network automatically in order to get more accurate results. The neural network toolbox is a user friendly GUI, which can be used in creating a few models at special areas.
Results
A model is developed here by the collected data from Shahid Rajayi industrial treatment plant of Tabriz to predict the quality of output sullage. The statistical analysis of the data will be explained first and its results will be presented after. All the analysis of this section and the training of the neural network is done by MATLAB software and neural networks toolbox.
Data Analysis
Input and Output Data
A number of 144 data are obtained from the laboratory of Shahid Rajayi town treatment plant of Tabriz. These data are used simultaneously in training, validation and testing of the neural network. These data include BOD, COD, TSS, pH and temperature of the input sullage and also TSS, BOD and COD of output sullage.
Correlation Analysis
The correlation coefficient is a statistical tool for determining the type and degree of relation between one quantitative variable and another. The correlation coefficient is one of the criteria used in determining the correlation between two variables. The correlation coefficient shows the intensity of a relation and also the type of relation (direct or reverse). This coefficient is between 1 and -1, and is equal to zero in the case of no relation between two variables. The correlation between two random variables X and Y is defined as follows:

In which, E is the expected value operator, cov means covariance, and, corr a widely used alternative notation for the correlation coefficient.
It was necessary to do the correlation analysis between the candidate required input and output variables in order to choose the proper inputs to predict TSS, BOD and COD. Therefore, a correlation analysis is performed between BOD, COD, TSS, pH and temperature of the input and TSS, BOD and COD of the output sullage.
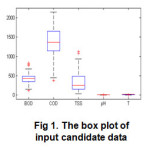
Box Plot
The box plot for input and output data are presented in this section. The box plot could help a lot to analyze the input and output of a system which we want to model. Figure 1 shows the box plot for 5 candidate input. As it can be seen from this figure, distribution of inputs for pH and temperature is very low and is negligible compared to other variables. This problem is solvable by preprocessing the data and normalizing them between 1 and -1, and will be discussed in the next section.
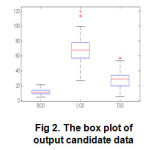
The box plot for the output of the treatment plant is shown in figure 2. Distribution of COD is more than other variables.
 |
|
 |
|
Data Preprocessing
Processing at the procedure of updating the weight is done to assign the equal variable weight, especially while using the nonlinear transfer function, according to the distribution of used data in the neural network and after preparing the data to develop the model. Preprocessing of the data is done by allocating the input and output data to the range [0, 1] or [-1, 1]. This transformation is as follows for all the data points:
For the interval [ 0, 1]:

Each data variable should be fed into the neural network model using normalization of input data with nonlinear transfer functions such as logsig, tansig and with equal weight. Therefore, the data should be scaled by the equations (5) and (6) in the intervals [0, 1] and [-1, 1], respectively.
Modeling The Procedure
The laboratory data recorded in the treatment plant of Shahid Rajayi industrial town is used for modeling the input and output of the treatment plant. The total of 144 records of inputs and outputs is extracted after removing the incomplete and duplicate data. This amount of data is divided randomly into three sets. Transposing the inputs of neural network does not matter, since the modeling is static and the used neural network (feed forward neural network) is only able to do the static mappings. Therefore, dividing the data set randomly into three groups of training, validation and test is proper. The existing data in the training set are used to train the network. 60 percent of data are used in training, 20 percent in validation and 20 percent in the test of the neural network. The parameters (BOD, COD, TSS, temperature and pH) of the input sullage are used to predict the quality parameters of the sewage.
Developing the Model By Five Inputs
Developing the prediction model of the output sewage quality parameters (BOD, COD, and TSS) is done in this section using five inputs of BOD, COD, TSS, pH and the temperature of input sullage. We are using a neural network here, which dedicated to each one of the output parameters in order to predict them. Like the previous section, these neural networks are also named from 1 to 3 and are predicting BOD, COD and TSS, respectively.
The Network Number one with Five Inputs
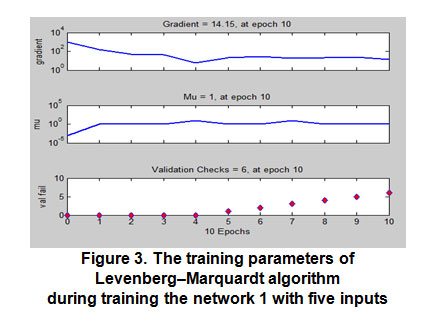
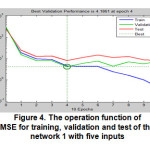
The neural network number one in this section is predicting BOD of the output sullage of the treatment plant. The best resulted prediction here relates to a network with two hidden layers consisting of 10 neurons at the first hidden layer and 15 neurons in the second hidden layer. It seems reasonable to use more neurons or more layer to find the unknown relation between the inputs and the outputs regarding the fact that the number of inputs has increased. On the other hand, the results and values obtained here are very dependent to initial weight functions and each training changes significantly. Therefore, it may be possible to reach better results by more runs and more trial and error. Figure 3 shows the training parameters of the Levenberg–Marquardt algorithm during the training. The value of MSE function also is shown in figure 4, which is chosen as the operation function. As it can be seen from the figure, the training has stopped at the period 10, and the best result is obtained from the period 4.
 |
|
 |
|
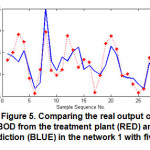
The comparison of real results and predicted results in predicting the output BOD by the neural network 1 is presented in figure 5 in order to observe the network performance.
 |
|
The Network Number Two With Five Inputs
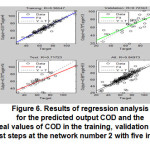
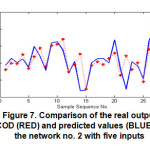
The network number two predicts the output COD by getting five inputs. Only the regression analysis and comparison results are provided here to avoid redundancy. Figure 6 shows the results of regression analysis for this network. The value for R in this test is 0.717 for the network. Figure 7 shows the comparison between the predicted output COD and the actual recorded values of the treatment plant. These results indicate that the performance of the network number 2 with five inputs is correct. The trained network has two hidden layers at this section that includes 10 and 7 neurons in each layer, respectively.
 |
|
 |
|
The Network Number Three With Five Inputs
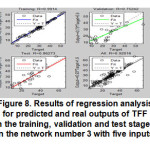
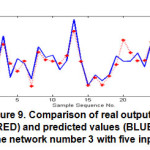
Finally, the network number three is developed to predict the output TSS. This network utilizes one hidden layer. The size of the hidden layer in this network includes 22 neurons. The obtained R of this network is 0.86 in the test section. Figure 8 shows the results of regression analysis. The comparison of the results is also shown in the figure 9. This figure indicates the high accuracy of predicting in the output values of TSS.
 |
|
 |
|
The values of R is shown in Table 1.
Table 1: Values of R with five inputs
|
|
TSS |
COD |
|
BOD |
Average |
|
Five inputs |
0.862 |
0.717 |
0.744 |
0.774 |
Discussion and Conclusion
An artificial neural network is developed in this research to predict the output quality of sewage (BOD, COD, and TSS) in the Shahid Rajayi industrial town treatment plant of Tabriz. This model is based on the feed forward neural networks and back propagation error training method and also the Levenberg-Marquardt algorithm. A number of 144 data were received from the laboratory of the industrial treatment plant. This data is analyzed statistically at first and then was given to the neural network after preprocessing. Five inputs, including BOD, COD, TSS, pH, and temperature of the input sullage are used in prediction, which were the input for the neural network model. The obtained results in this research indicate that the developed neural network has sufficient accuracy to predict the quality of output sullage. Based on the works done and obtained results of this research, it seems that the existing data are very noisy and has errors. Therefore, using neural networks in modeling the treatment plant procedure is strongly recommended.
References
- Al-Asheh, S., Alfadala, H.E., Use of artificial neural network black-box modeling for the prediction of wastewater treatment plants performance, Journal of Environmental Management, 83(3), 329–338. (2007)
- Arsi Vala, Wastewater Treatment, Translate by Ahmadreza Yazdanbkhsh, Kazem nadafi, Fardabeh Press. (1993)
- Chalkesh Amiri, M., Principles of water treatment, Esfahan, Arkan Press. (2010)
- Dogan, E. e. a. "Application of Artificial Neural Networks to Estimate Wastewater Treatment Plant," Environmental Progress, 27 ( 4), 439-445, (2008)
- Farahani, L. M., Urban sewage sludgemanagement plan (case study: treatment plant of Ghods town), Journal of Environment, 30. (2001)
- Guclu D. and Dursun, S. "Artificial neural network modelling of a large-scale wastewater treatment," Bioprocess Biosyst Eng, 33, 1051–1058, (2010)
- Holubar,P., et al . Advanced controlling of anaerobic digestion by means of hierarchical neural Water Research. 36: 2582-2588. (2002)
- Kermani, M., Improving the efficiency and economic empowerment of stabilization pond waste water treatment plants, Second conference of Planning and Environmental Management. (2012)
- Khosravi, S. Panjeshahi , M. H. and Ataei, A. "Application of exergy analysis for quantification and optimisation of the environmental performance in wastewater treatment plants," J. of Exergy, 12, (1), 119-138, (2013)
- Mogens Henze, Wastewater treatment of chemical and biological processes, Translated by Ahmadreza Yazdanbakhsh, Mostafa Leili, Ali kulivand, Hafiz Press. (2007)
- Monzavi, M., Urban wastewater, First Eddition: Wastewater collection, Eighth Edition, Tehran, Tehran University Press. (1998)
- Mehdipour Torghabeh, A., Shokuhiyan, M., Investigating the effect of input redundancy on the prediction accuracy of sullage COD of the industrial sewage treatment plants using artificial neural network, The Sixth National Conference on Environmental Engineering. (2012)
- Mehdipour Torghabeh, A., Shokuhiyan, M., Performance evaluation of the industrial treatment plants using artificial neural networks, Sixth National Conference and Exhibition of Environmental Engineering. (2012)
- Mehdipour Torghabeh, A., Shokuhiyan, M., Estimating the concentration of output sullage TSS of the industrial waste treatment plant using artificial neural network, Seventh National Congress of Civil Engineering, Zahedan, University of Sistan and Baluchestan. (2013)
- Metcalf, E. Wastewater Engineering Treatment And Reuse, 4 ed., McGraw hill, (2003)
- Rodriguez,M.J. , J.B.,Se´rodes . Assessing empirical linear and non-linear modelling of residual chlorine in urban drinking water systems. Environmental Modelling & Software. 14 (1): 93-102. (1999)


